Dashboard Chart
Advertisement
TeeChart Pro VCL/FMX v.2012
VCL Charting Component Specifications: -For Delphi 5,6,7,8 (.Net), 2005, 2006, 2007, 2009, 2010, XE, XE2 and C++ Builder 5,6, 2007, 2009, 2010, XE, XE2, Developer Studio 2006, RAD Studio 2007, 2009, 2010, XE, XE2 and FireMonkey -Printing and
Advertisement

LightningChart Ultimate SDK v.2.0.1
LightningChart Ultimate is the fastest 2D and 3D measurement, engineering and research data visualization SDK for .NET and Windows.
TeeChart Pro v.5 3
TeeChart Pro provides complete, quick and easy to use charting and plotting ActiveX COM and Borland VCL / CLX classes for Business, Real-Time, Financial and Scientific applications.
.NET Dashboard Suite
.NET Dashboard Suite package includes Instrumentation ModelKit and Chart ModelKit. These components are intended for complicated and intelligent digital dashboard creation. .NET Dashboard package components feature identical designers, unique
Dashboard Tools for Excel v.2.2.0
With Dashboard Tools for Excel you can use Sparklines, Heatmaps, Mini Charts, Bump charts and other special charts, getting dramatically improved data visualization for fast and effective parallel comparisons.
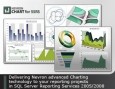
Nevron Chart for SSRS 2009_Vol.1 v.1.0
Nevron Chart for SQL Server Reporting Services (SSRS) is an advanced report item, which delivers a complete set of 2D and 3D charting types, highly customizable axes, tight data integration and unmatched visual effects to your reports.
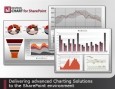
Nevron Chart for SharePoint 2010_Vol.1 v.1.0
Based on the latest version of Nevron?s Charting Engine for ASP.NET and the new Nevron Pivot Data Aggregation Engine, Nevron Chart for SharePoint is optimized for SharePoint (WSS and MOSS),
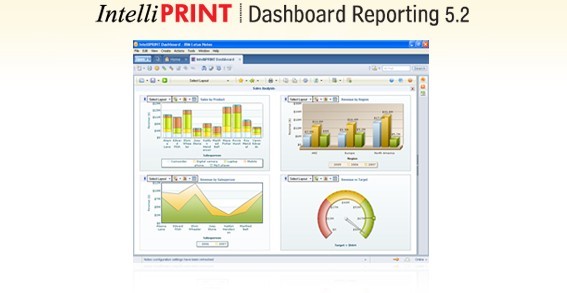
IntelliPRINT Dashboard Reporting v.5.2
IntelliPRINT Dashboard Reporting is a native dashboard reporting and analysis solution specifically designed for Lotus Notes & Domino applications that enables business users to create, modify, analyze and distribute dashboard reports INSIDE Lotus No

Swiftchart: chart, graph java applet
Chart java applet software to generate dynamic charts and graphs - bar, line, pie, stacked and grouped charts in 2D and 3D with a wide range of parameters and chart types. Main features: Charts in 2D/3D, Anti aliasing, Multi language support, Cross

Java Chart Designer
Create professionally looking presentations and reports with Java Chart Designer. Feature rich and powerful application gives you full power to create outstanding report and presentation projects. A user-friendly interface, great number of visual effects
PDF Chart Creator Dynamic Link Library
The PDF Chart Creator Dynamic Link Library is a utility that will create charts from data as a PDF document. The conversion process is fully controlled through the provided Application Programming Interface and the royalty free DLL can be included and